Your Monthly Digital Marketing Report Format: Template and Walkthrough
Each month a gift arrives in your inbox. Your monthly digital marketing report!
Regardless of what agency you work with, hopefully they’re providing you with reports. Digital marketing reports help businesses understand where traffic is coming from, where it’s headed and why it all matters.
Oneupweb’s full monthly reports are endlessly customizable. Depending on the services and area of focus, we tailor our monthly digital marketing reports to reflect the information most relevant to our clients.
But all that valuable information doesn’t mean much if you don’t know how to read it.
So, let’s dive in!
Prefer to talk to someone?
Our digital marketing reports run on Google Looker Studio.
In 2019, our agency switched from our previous reporting software to Google Looker Studio, formerly known as Data Studio, to create our paid media, organic, ecommerce and other monthly reports.
With the help of the Supermetrics connector, we can present far more than just Google Analytics data. We tap into HubSpot, Facebook, YouTube, Semrush and so many more programs to measure and track digital marketing successes.
We built our Looker Studio SEO report template to showcase the basics of using the software for your reporting. Make the most of the platform (it’s free!) and use our template to integrate with your Google Analytics account.
How to Create a Report in Looker Studio Using Our Free Digital Marketing Report Template
Are you ready to dive in? Great – download our free template here:
To start building your own report from our template, you’ll need to sign into Looker Studio, make a copy of our digital report template and connect your Google Analytics view and Google Search Console account as the data sources. Your Google Analytics view should be the default data source, while your Google Search Console account will control the keyword data only.
Once you’ve done this, the blank boxes will turn into your digital marketing report. You may need to tweak some Advanced Segments and filters for individual charts. We’ve found Looker Studio to work well for visualizing performance and making marketing decisions, so feel free to expand your report as needed.
Let’s Look at This Digital Marketing Report Sample
Section 1
At the top of your monthly report, include your business name and select the desired date range.
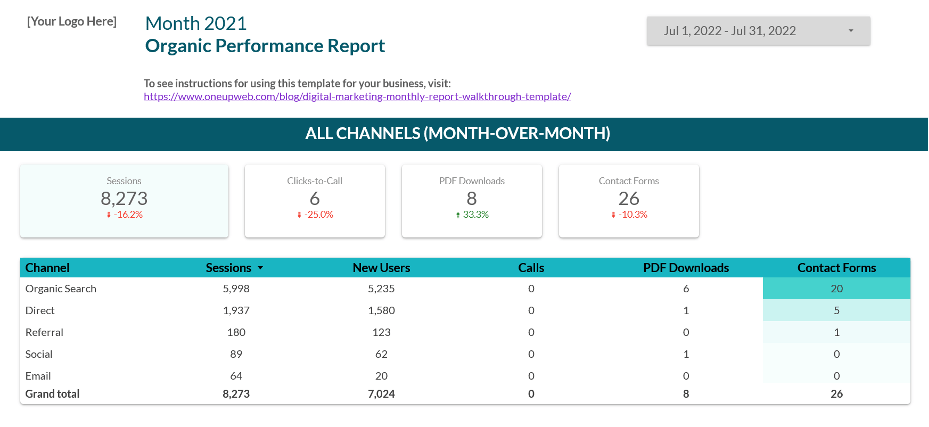
Here, you can see we’ve chosen a full month as the date range (July 1 – 31, 2022), but feel free to look at a larger or smaller date range.
The built-in comparison date ranges in our Data Studio report template are set to “period-over-period.” No matter which date range you choose, any comparison data shown will use the previous period of equal length.
If you haven’t opened it yet, get our free digital report template by filling in the form below:
Find important metrics right at the top of this first section. Tweak according to what’s most important to you.
- Form submits. How many users are contacting your business via an online form? As the primary metric for this chart, choose the relevant “form submit” Goal in your Google Analytics account.
- Sessions. The number of visits to your site this month.
- Clicks-to-call. If you have phone number click tracking set up in Google Analytics (as an Event or Goal), connect that metric to this chart within our template. Want to track clicks-to-call from your Google Business Profile search results instead of only your website? Here’s how to set up click tracking and other goals.
- PDF downloads. If you operate in a business where you’re collecting user information with downloads and other gated content, it’s important to track what’s being downloaded each month. If you’re using our monthly digital marketing report template, just connect the relevant Event or Goal as the metric for this chart.
The “Default Channel Grouping” table breaks down performance for direct, organic search, social, paid search and other channels, showing you how users are reaching your site. In the columns, you can see exactly what types of goal completions those sessions are leading to. Feel free to add engagement metrics to this table too, such as bounce rate and session duration.
The symbol “%▲” represents the percent change (in this case, it’s month-over-month) for the metric in the previous column.
Google Analytics terms confusing?
Section 2
The next section focuses on the location of users reaching your site.
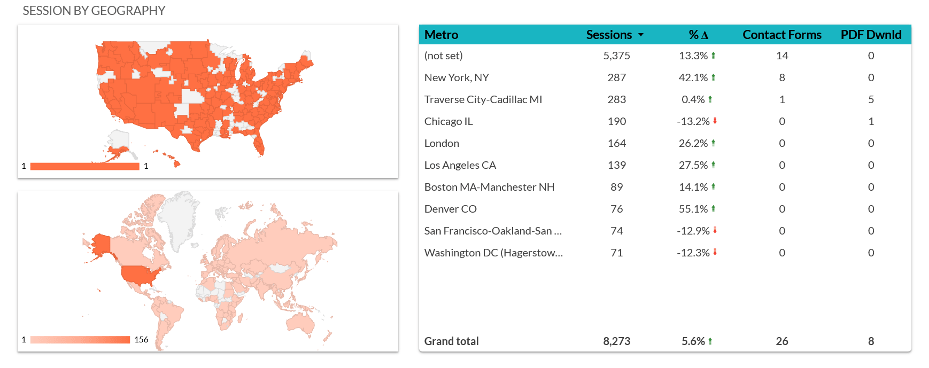
The maps show total website sessions by geography (US and global), while the table breaks it down by metro area. Again, you can see how this data is tied to goal completions like form fills or calls.
Location is more important to some businesses than to others, but these maps can tell you a lot. Do you focus on a single region but get traffic from the wrong places? Maybe some of your paid media campaigns are targeting too wide of an area – and wasting your money.
You can also copy these maps and apply a channel filter (e.g., organic, paid, social, etc.) to get more specific insights into the channels you’re focusing on.
Bonus tip: When you put an “organic search” channel filter on these maps, you can see if your SEO strategy for different regions is working. Are you using local SEO? Find out why local SEO makes a big difference.
Section 3
For the next section of your digital marketing report, we focus on organic search.
We are a full-service digital marketing company, and we love search engine optimization. We spend a lot of time optimizing client websites, so we make sure our reports reflect the impact on organic search website performance. Your free report template does something similar:
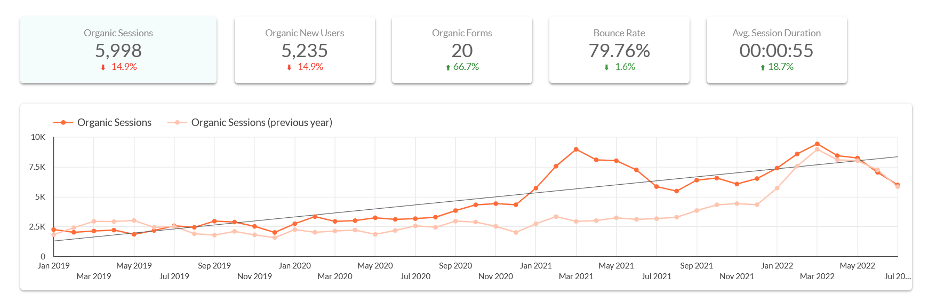
While the previous sections of this month-end report template focused on hard conversions (like form completions), the organic search sections dig deeper into engagement. Why? Beyond getting more customers, organic search marketing is about engagement, thought leadership and domain authority.
- Sessions. The number of organic search sessions on your site.
- New users. People who reached your site organically for the first time during the selected date range. (In some cases, a person who clears cookies or switches devices might be counted twice by Google.)
- Bounce rate. You want this number to be low, though it varies from page to page. Learn why bounce rate is a useful engagement metric.
- Average session duration. This number illustrates how long users are spending on your site during organic sessions, regardless of how many pages they look at.
These KPIs (key performance indicators) are a great start to understanding how users are interacting with your site and how your efforts are actualized. (Feel free to add your own charts if you want to see organic-only conversion metrics here, too.)
The line graph in this section shows how organic sessions are moving throughout this year, compared to last year. Because the SERP is constantly changing and organic traffic fluctuates a lot, looking at the entire year gives a more complete picture of trends and seasonality.
Section 4
This part of the marketing report template shows top-performing organic landing pages:
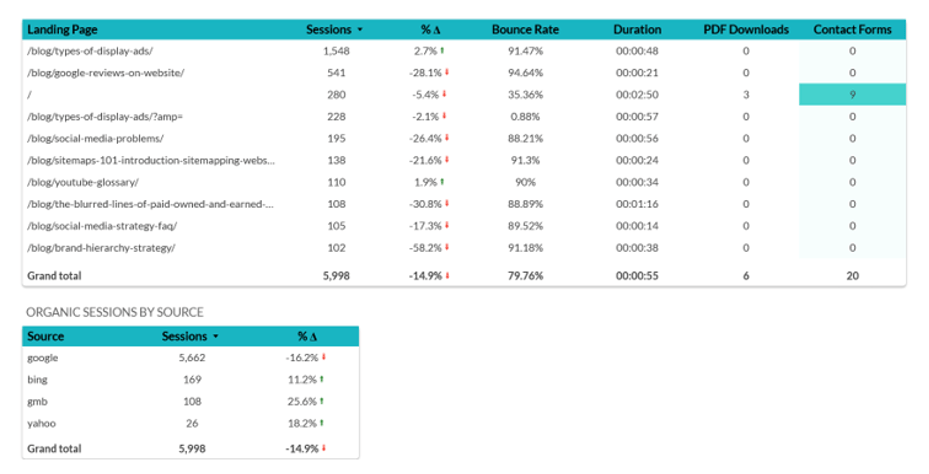
The pages shown are where users land on your site after they type a query into a search engine. We’ve included sessions, bounce rate, average session duration and actions like form fills and downloads.
Identifying top-performing pages and blogs helps you decide where to improve content and user experience. For us, the top-performing blog in the screenshot has brought us a lot of organic traffic, but has a very high bounce rate. We’re constantly optimizing our blogs so we can learn how users engage with content and which pages they visit after reading one of our posts.
In this section, we also look at which sources the organic searches are coming from. You can see Google and Bing are top, but it’s important to keep track of all organic traffic sources. For example, one month we noticed a huge dip in Bing traffic. We resubmitted our XML sitemap to the search engine, and in no time, things returned to normal.
Bonus tip: To track your Google Business traffic as a separate source, just add this tag to the end of the website link within your business listing: ?utm_source=gmb&utm_medium=organic&utm_campaign=local
Section 5
The last section of our report template focuses on search queries and device type.
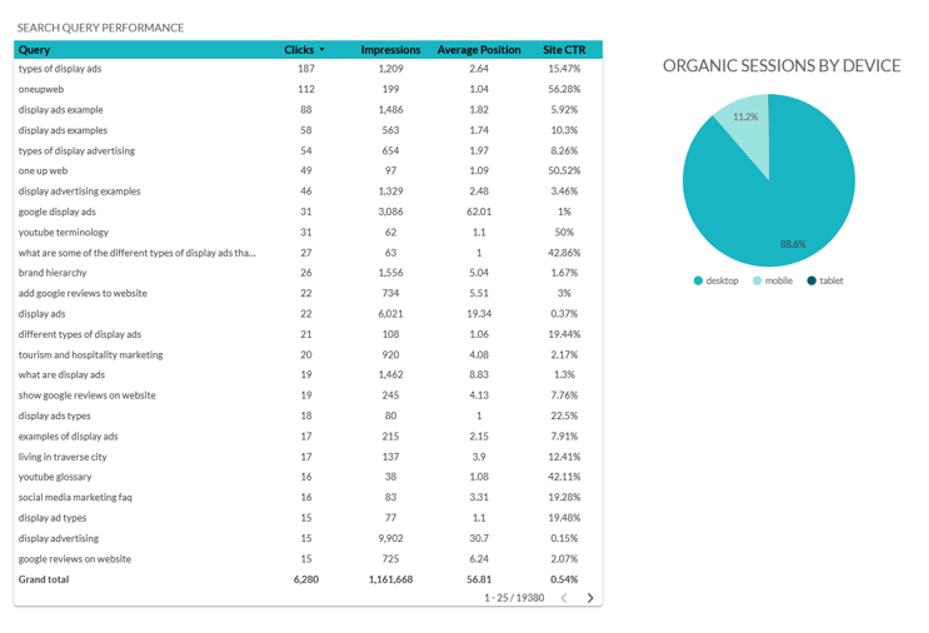
This “Search Query Performance” table shows you how your site ranks for specific keywords in search engine results, and how many clicks and impressions result from those searches. It can help you decide which new content to create or where to spend time optimizing.
For example, if people keep landing on your site due to a keyword that’s irrelevant to your business, some of your content could be misleading to search engines. If you create a piece of content and start ranking for related keywords within a few months, you probably did a decent job of optimizing for SEO.
The pie chart identifies organic sessions by device. As you can see, our site is used mostly by desktop users, and only about 11 percent of users are on their phones. Though every website should be optimized for mobile UX, it’s helpful to see what devices your audience is using.
A Digital Marketing Performance Report Template Is Just the Start
A monthly digital marketing report does more than summarize performance metrics; it helps you make fact-based marketing decisions with confidence. Find out how Oneupweb can help you measure your marketing efforts and create effective strategies based on data and not gut feelings. Get in touch or call 231.922.9977 to get started!